Luftforurening i Kelowna: Real-time Air Quality Index og smog alarm.
| index | 2020-05 | 2020-04 | 2020-03 | 2020-02 | 2020-01 | 2019-12 | 2019-11 | 2019-10 | 2019-09 | 2019-08 | 2019-07 | 2019-06 | 2019-05 | 2019-04 | 2019-03 | 2019-02 | 2019-01 | 2018-12 | 2018-11 | 2018-10 | 2018-09 | 2018-08 | 2018-07 | 2018-06 | 2018-05 | 2018-04 | 2018-03 | 2018-02 | 2018-01 | 2017-12 | 2017-11 | 2017-10 | 2017-09 | 2017-08 | 2017-07 | 2017-06 | 2017-05 | 2017-04 | 2017-03 | 2017-02 | 2017-01 | 2016-12 | 2016-11 | 2016-10 | 2016-09 | 2016-08 | 2016-07 | 2016-06 | 2016-05 | 2016-04 | 2016-03 |
|---|---|---|---|---|---|---|---|---|---|---|---|---|---|---|---|---|---|---|---|---|---|---|---|---|---|---|---|---|---|---|---|---|---|---|---|---|---|---|---|---|---|---|---|---|---|---|---|---|---|---|---|
| o3:ppm | 0.03 (Good) | 0.03 (Good) | 0.03 (Good) | 0.02 (Good) | 0.02 (Good) | 0.01 (Good) | 0.01 (Good) | 0.02 (Good) | 0.02 (Good) | 0.03 (Good) | 0.02 (Good) | 0.03 (Good) | 0.03 (Good) | 0.03 (Good) | 0.03 (Good) | 0.03 (Good) | 0.02 (Good) | 0.02 (Good) | 0.01 (Good) | 0.01 (Good) | 0.02 (Good) | 0.02 (Good) | 0.03 (Good) | 0.03 (Good) | 0.04 (Good) | 0.04 (Good) | 0.03 (Good) | 0.03 (Good) | 0.01 (Good) | 0.02 (Good) | 0.02 (Good) | 0.02 (Good) | 0.02 (Good) | 0.03 (Good) | 0.04 (Good) | 0.03 (Good) | 0.03 (Good) | 0.03 (Good) | 0.02 (Good) | 0.03 (Good) | 0.02 (Good) | 0.02 (Good) | 0.01 (Good) | 0.01 (Good) | 0.02 (Good) | 0.02 (Good) | 0.02 (Good) | 0.03 (Good) | 0.03 (Good) | 0.03 (Good) | 0.03 (Good) |
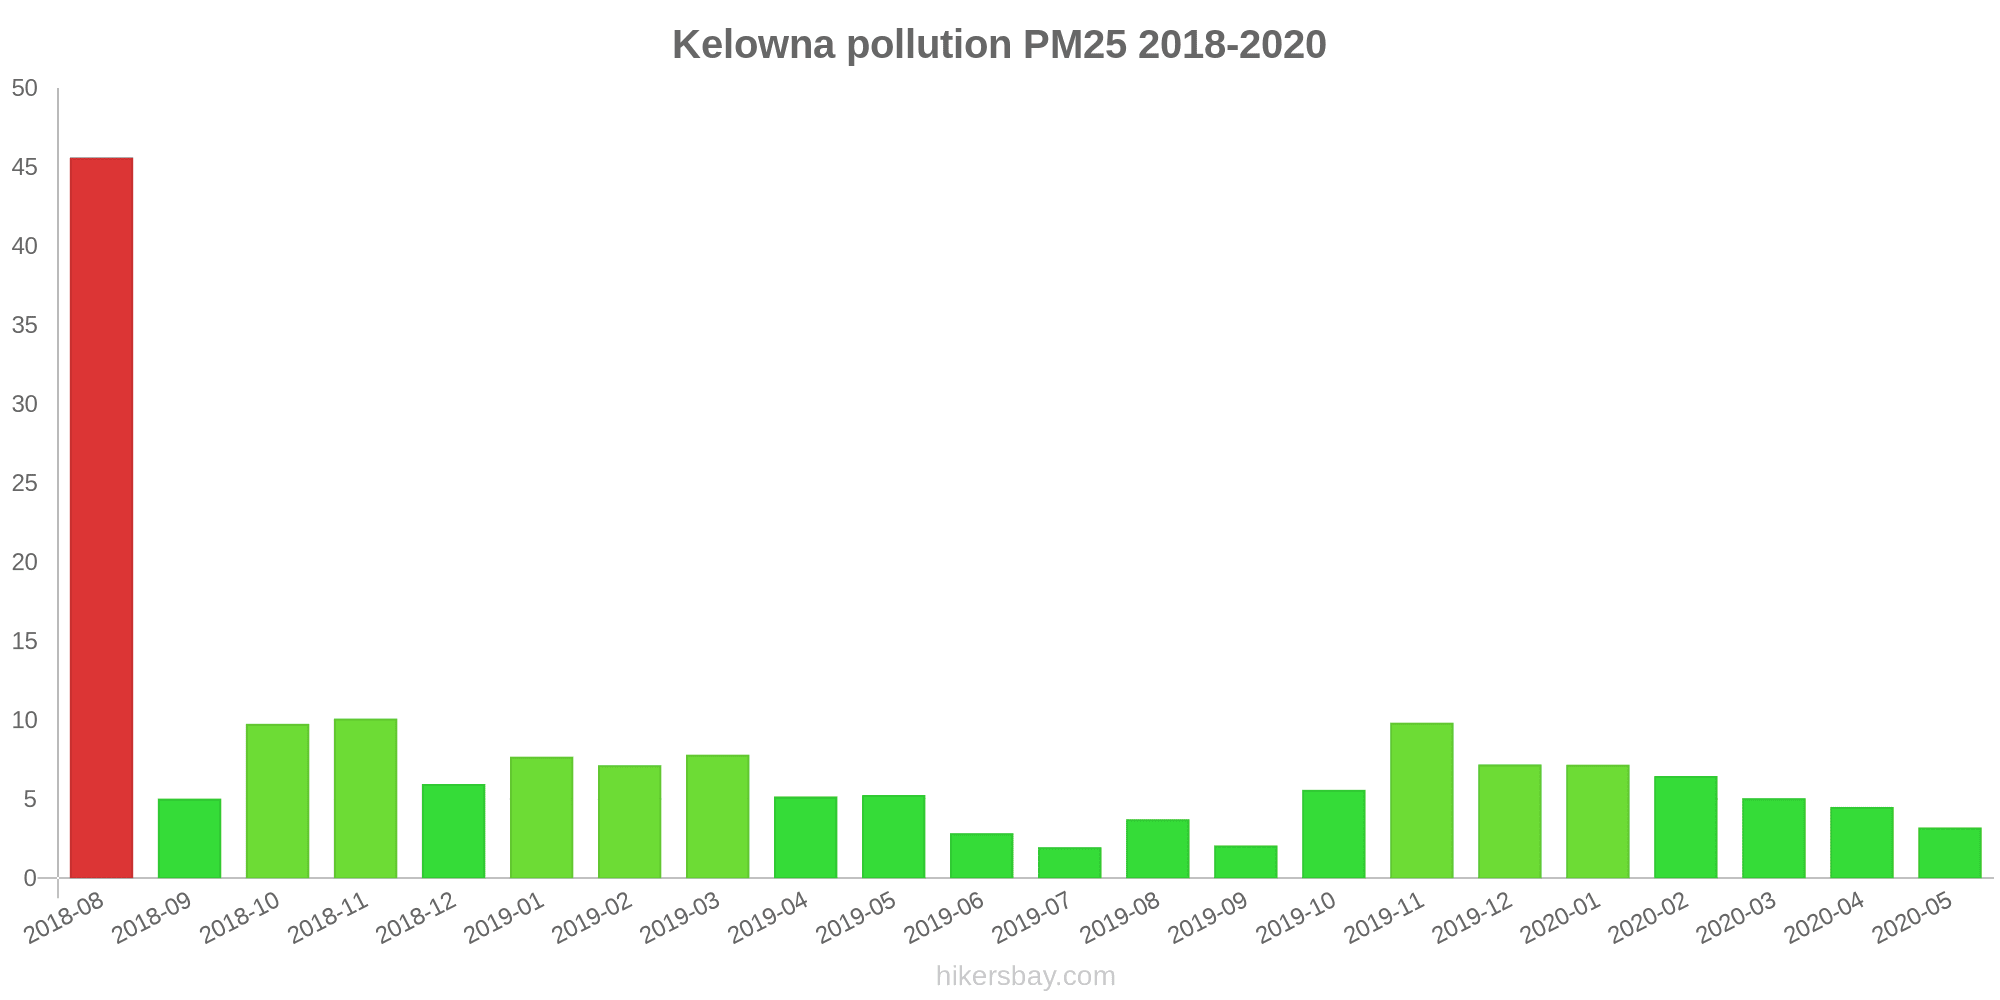
| pm25 | 3.2 (Good) | 4.5 (Good) | 5.1 (Good) | 6.5 (Good) | 7.2 (Good) | 7.2 (Good) | 9.8 (Good) | 5.6 (Good) | 2.1 (Good) | 3.7 (Good) | 2 (Good) | 2.9 (Good) | 5.3 (Good) | 5.2 (Good) | 7.8 (Good) | 7.2 (Good) | 7.7 (Good) | 6 (Good) | 10 (Good) | 9.8 (Good) | 5 (Good) | 46 (Unhealthy for Sensitive Groups) | - (Good) | - (Good) | - (Good) | - (Good) | - (Good) | - (Good) | - (Good) | - (Good) | - (Good) | - (Good) | - (Good) | - (Good) | - (Good) | - (Good) | - (Good) | - (Good) | - (Good) | - (Good) | - (Good) | - (Good) | - (Good) | - (Good) | - (Good) | - (Good) | - (Good) | - (Good) | - (Good) | - (Good) | - (Good) |
Livskvalitet i Kelowna
Grønne og parker i byen
Kelowna 84 %
USA: 70 % Venezuela: 41 % Island: 72 %partikler PM2,5
Kelowna 9 (Good)
Fornøjelse at tilbringe tid i byen
Kelowna 84 %
USA: 75 % Bahamas: 53 % Venezuela: 41 % Island: 89 %partikler PM10
Kelowna 16 (Good)
Luftforurening
Kelowna 22 %
USA: 29 % Bahamas: 52 % Venezuela: 59 % Island: 13 %Bortskaffelse af affald
Kelowna 85 %
USA: 71 % Bahamas: 29 % Venezuela: 18 % Island: 79 %Drikkevandets tilgængelighed og kvalitet
Kelowna 78 %
USA: 71 % Bahamas: 55 % Venezuela: 28 % Island: 96 %Renlighed og ryddelighed
Kelowna 78 %
USA: 60 % Bahamas: 35 % Venezuela: 22 % Island: 75 %Støj- og lysforurening
Kelowna 35 %
USA: 47 % Bahamas: 39 % Venezuela: 47 % Island: 23 %Vandforurening
Kelowna 33 %
USA: 44 % Bahamas: 58 % Venezuela: 76 % Island: 8,4 %Kelowna College
| index | 2020-05 | 2020-04 | 2020-03 | 2020-02 | 2020-01 | 2019-12 | 2019-11 | 2019-10 | 2019-09 | 2019-08 | 2019-07 | 2019-06 | 2019-05 | 2019-04 | 2019-03 | 2019-02 | 2019-01 | 2018-12 | 2018-11 | 2018-10 | 2018-09 | 2018-08 | 2018-07 | 2018-06 | 2018-05 | 2018-04 | 2018-03 | 2018-02 | 2018-01 | 2017-12 | 2017-11 | 2017-10 | 2017-09 | 2017-08 | 2017-07 | 2017-06 | 2017-05 | 2017-04 | 2017-03 | 2017-02 | 2017-01 | 2016-12 | 2016-11 | 2016-10 | 2016-09 | 2016-08 | 2016-07 | 2016-06 | 2016-05 | 2016-04 | 2016-03 |
|---|---|---|---|---|---|---|---|---|---|---|---|---|---|---|---|---|---|---|---|---|---|---|---|---|---|---|---|---|---|---|---|---|---|---|---|---|---|---|---|---|---|---|---|---|---|---|---|---|---|---|---|
| o3:ppm | 0.03 | 0.03 | 0.03 | 0.02 | 0.02 | 0.01 | 0.01 | 0.02 | 0.02 | 0.03 | 0.02 | 0.03 | 0.03 | 0.03 | 0.03 | 0.03 | 0.02 | 0.02 | 0.01 | 0.01 | 0.02 | 0.02 | 0.03 | 0.03 | 0.04 | 0.04 | 0.03 | 0.03 | 0.01 | 0.02 | 0.02 | 0.02 | 0.02 | 0.03 | 0.04 | 0.03 | 0.03 | 0.03 | 0.02 | 0.03 | 0.02 | 0.02 | 0.01 | 0.01 | 0.02 | 0.02 | 0.02 | 0.03 | 0.03 | 0.03 | 0.03 |
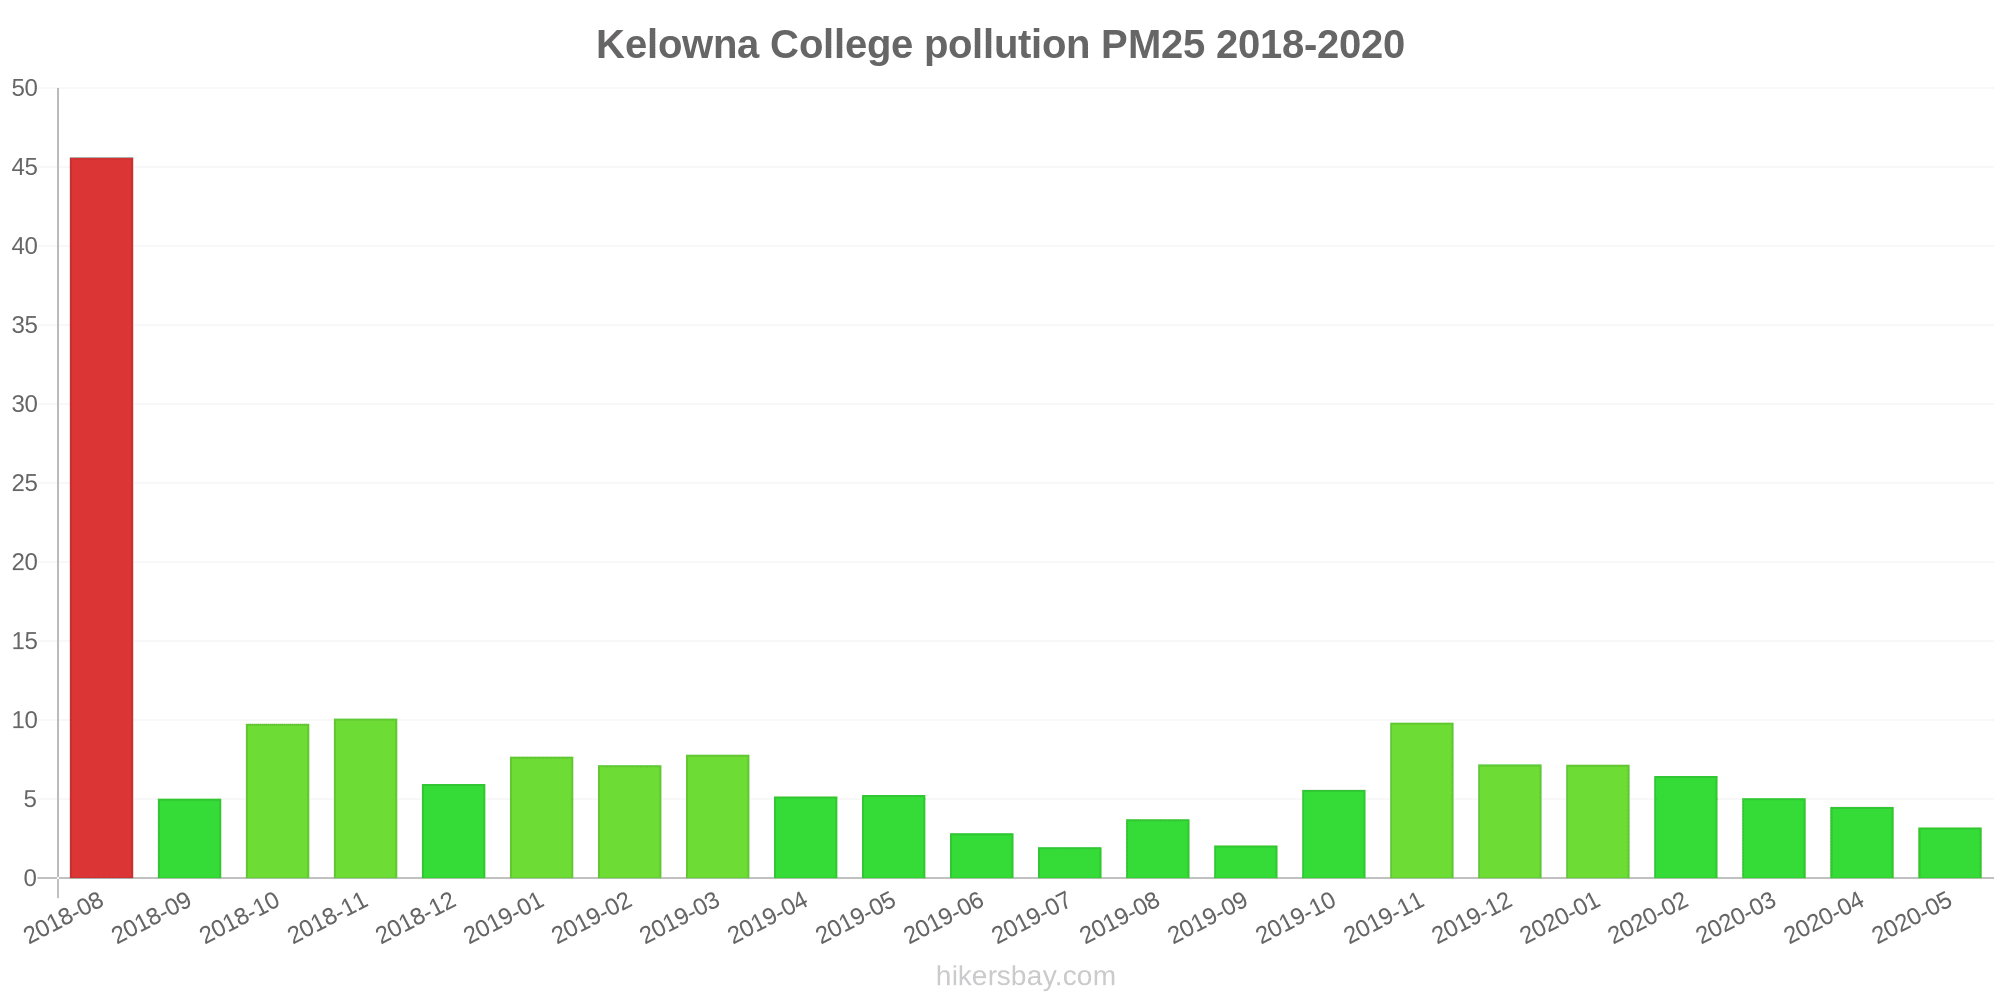
| pm25 | 3.2 | 4.5 | 5.1 | 6.5 | 7.2 | 7.2 | 9.8 | 5.6 | 2.1 | 3.7 | 2 | 2.9 | 5.3 | 5.2 | 7.8 | 7.2 | 7.7 | 6 | 10 | 9.8 | 5 | 46 | - | - | - | - | - | - | - | - | - | - | - | - | - | - | - | - | - | - | - | - | - | - | - | - | - | - | - | - | - |