Air Pollution in Gulera: Real-time Air Quality Index and smog alert.
Pollution and air quality forecast for Gulera. Today is Saturday, May 30, 2026. The following air pollution values have been recorded for Gulera:- particulate matter (PM10) suspended dust - 82 (Unhealthy)
- sulfur dioxide (SO2) - 9 (Good)
- particulate matter (PM2.5) dust - 26 (Moderate)
- carbon monoxide (CO) - 590 (Good)
- nitrogen dioxide (NO2) - 29 (Good)
- ozone (O3) - 12 (Good)

What is the air quality in Gulera today? Is the air polluted in Gulera?. Is there smog?
What is the level of PM10 today in Gulera? (particulate matter (PM10) suspended dust)
The current level of particulate matter PM10 in Gulera is:
82 (Unhealthy)
The highest PM10 values usually occur in month: 203 (February 2019).
The lowest value of particulate matter PM10 pollution in Gulera is usually recorded in: April (57).
What is the level of SO2 pollution? (sulfur dioxide (SO2))
9 (Good)
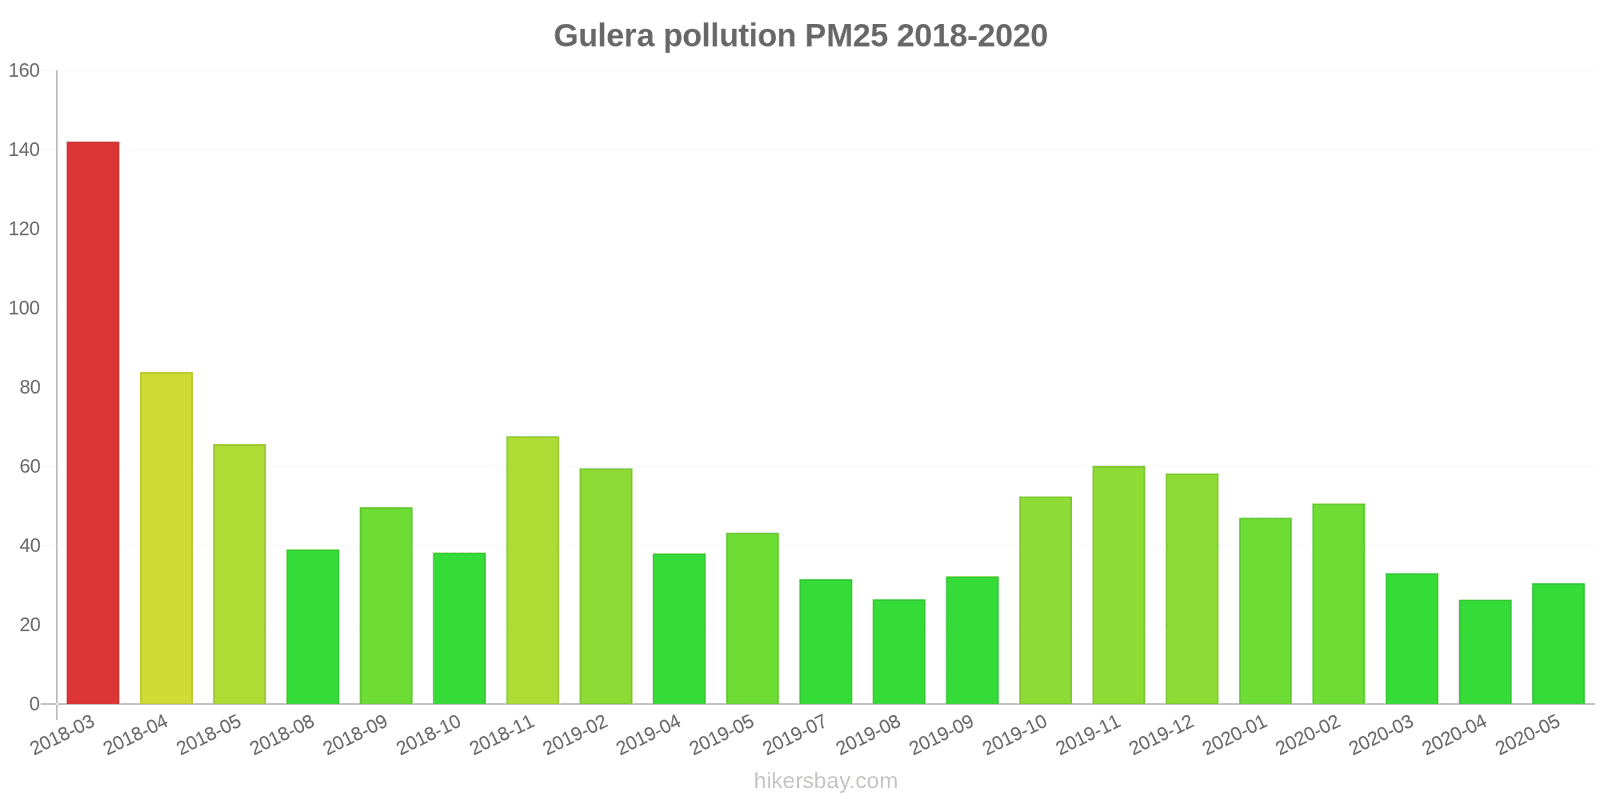
What is the current level of PM2.5 in Gulera? (particulate matter (PM2.5) dust)
Today's PM2.5 level is:
26 (Moderate)
For comparison, the highest level of PM2.5 in Gulera in the last 7 days was: 24 (Monday, October 31, 2022) and the lowest: 24 (Monday, October 31, 2022).
The highest PM2.5 values were recorded: 142 (March 2018).
The lowest level of particulate matter PM2.5 pollution occurs in month: April (26).
How high is the CO level? (carbon monoxide (CO))
590 (Good)
How high is the level of NO2? (nitrogen dioxide (NO2))
29 (Good)
How is the O3 level today in Gulera? (ozone (O3))
12 (Good)
Current data Monday, October 31, 2022, 1:45 AM
PM10 82 (Unhealthy)
SO2 9 (Good)
PM2,5 26 (Moderate)
CO 590 (Good)
NO2 29 (Good)
O3 12 (Good)
Data on air pollution from recent days in Gulera
index
2022-10-31
pm10
68
Unhealthy for Sensitive Groups
so2
8
Good
pm25
24
Moderate
co
505
Good
no2
28
Good
o3
10
Good
data source »
Air pollution in Gulera from March 2018 to May 2020
index
2020-05
2020-04
2020-03
2020-02
2020-01
2019-12
2019-11
2019-10
2019-09
2019-08
2019-07
2019-05
2019-04
2019-02
2018-11
2018-10
2018-09
2018-08
2018-05
2018-04
2018-03
pm25
31 (Moderate)
26 (Moderate)
33 (Moderate)
51 (Unhealthy for Sensitive Groups)
47 (Unhealthy for Sensitive Groups)
58 (Unhealthy)
60 (Unhealthy)
52 (Unhealthy for Sensitive Groups)
32 (Moderate)
26 (Moderate)
32 (Moderate)
43 (Unhealthy for Sensitive Groups)
38 (Unhealthy for Sensitive Groups)
60 (Unhealthy)
68 (Unhealthy)
38 (Unhealthy for Sensitive Groups)
50 (Unhealthy for Sensitive Groups)
39 (Unhealthy for Sensitive Groups)
66 (Unhealthy)
84 (Very Unhealthy)
142 (Very bad Hazardous)
pm10
60 (Unhealthy for Sensitive Groups)
57 (Unhealthy for Sensitive Groups)
68 (Unhealthy for Sensitive Groups)
102 (Unhealthy)
102 (Unhealthy)
119 (Very Unhealthy)
121 (Very Unhealthy)
111 (Very Unhealthy)
71 (Unhealthy for Sensitive Groups)
59 (Unhealthy for Sensitive Groups)
73 (Unhealthy for Sensitive Groups)
129 (Very Unhealthy)
77 (Unhealthy for Sensitive Groups)
203 (Very bad Hazardous)
190 (Very bad Hazardous)
108 (Unhealthy)
67 (Unhealthy for Sensitive Groups)
84 (Unhealthy)
160 (Very bad Hazardous)
154 (Very bad Hazardous)
124 (Very Unhealthy)
no2
12 (Good)
6.8 (Good)
15 (Good)
28 (Good)
27 (Good)
25 (Good)
23 (Good)
23 (Good)
15 (Good)
13 (Good)
10 (Good)
19 (Good)
20 (Good)
23 (Good)
23 (Good)
30 (Good)
20 (Good)
13 (Good)
25 (Good)
27 (Good)
32 (Good)
so2
10 (Good)
7.7 (Good)
12 (Good)
12 (Good)
9.4 (Good)
11 (Good)
9.5 (Good)
11 (Good)
12 (Good)
6.1 (Good)
6.6 (Good)
14 (Good)
11 (Good)
15 (Good)
11 (Good)
7.2 (Good)
6.4 (Good)
7.7 (Good)
12 (Good)
10 (Good)
11 (Good)
co
479 (Good)
428 (Good)
860 (Good)
1 (Good)
1 (Good)
1 (Good)
1 (Good)
1 (Good)
938 (Good)
851 (Good)
863 (Good)
586 (Good)
641 (Good)
1 (Good)
1 (Good)
1 (Good)
965 (Good)
637 (Good)
1 (Good)
25 (Good)
53 (Good)
o3
53 (Good)
50 (Good)
51 (Good)
42 (Good)
34 (Good)
34 (Good)
34 (Good)
28 (Good)
23 (Good)
29 (Good)
30 (Good)
57 (Good)
39 (Good)
29 (Good)
39 (Good)
31 (Good)
36 (Good)
23 (Good)
40 (Good)
- (Good)
- (Good)
data source »
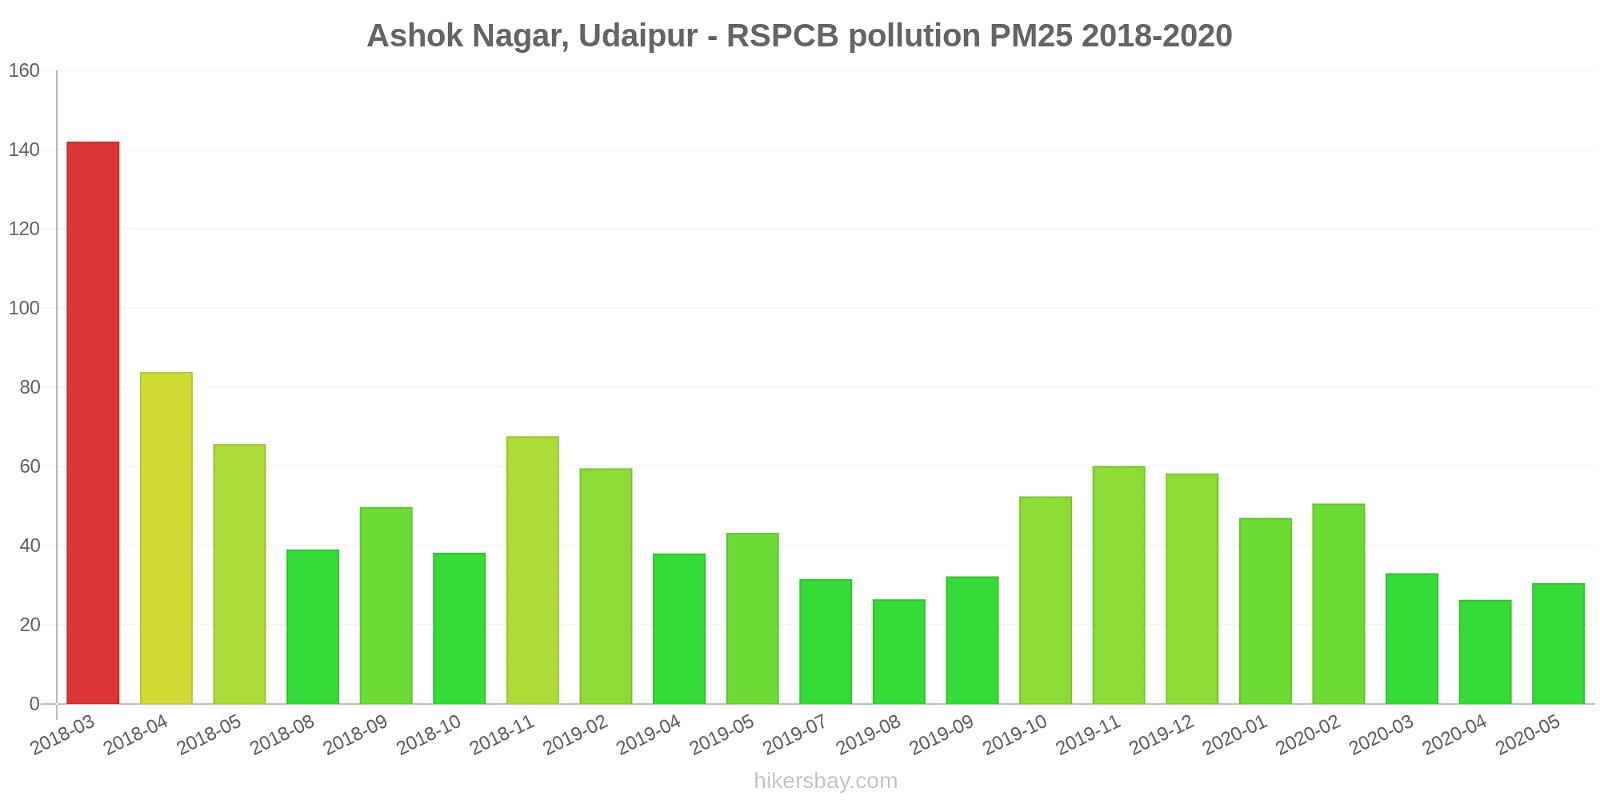
Ashok Nagar, Udaipur - RSPCB
Monday, October 31, 2022, 1:45 AM
PM10 82 (Unhealthy)
particulate matter (PM10) suspended dust
SO2 8.5 (Good)
sulfur dioxide (SO2)
PM2,5 26 (Moderate)
particulate matter (PM2.5) dust
CO 590 (Good)
carbon monoxide (CO)
NO2 29 (Good)
nitrogen dioxide (NO2)
O3 12 (Good)
ozone (O3)
Ashok Nagar, Udaipur - RSPCB
index
2022-10-31
pm10
68
so2
8
pm25
24
co
505
no2
28
o3
10
Ashok Nagar, Udaipur - RSPCB
2018-03 2020-05
index
2020-05
2020-04
2020-03
2020-02
2020-01
2019-12
2019-11
2019-10
2019-09
2019-08
2019-07
2019-05
2019-04
2019-02
2018-11
2018-10
2018-09
2018-08
2018-05
2018-04
2018-03
pm25
31
26
33
51
47
58
60
52
32
26
32
43
38
60
68
38
50
39
66
84
142
pm10
60
57
68
102
102
119
121
111
71
59
73
129
77
203
190
108
67
84
160
154
124
no2
12
6.8
15
28
27
25
23
23
15
13
10
19
20
23
23
30
20
13
25
27
32
so2
10
7.7
12
12
9.4
11
9.5
11
12
6.1
6.6
14
11
15
11
7.2
6.4
7.7
12
10
11
co
479
428
860
1
1
1
1
1
938
851
863
586
641
1
1
1
965
637
1
25
53
o3
53
50
51
42
34
34
34
28
23
29
30
57
39
29
39
31
36
23
40
-
-
* Pollution data source:
https://openaq.org
(caaqm)
The data is licensed under CC-By 4.0
PM10 82 (Unhealthy)
SO2 9 (Good)
PM2,5 26 (Moderate)
CO 590 (Good)
NO2 29 (Good)
O3 12 (Good)
Data on air pollution from recent days in Gulera
| index | 2022-10-31 |
|---|---|
| pm10 | 68 Unhealthy for Sensitive Groups |
| so2 | 8 Good |
| pm25 | 24 Moderate |
| co | 505 Good |
| no2 | 28 Good |
| o3 | 10 Good |

| index | 2020-05 | 2020-04 | 2020-03 | 2020-02 | 2020-01 | 2019-12 | 2019-11 | 2019-10 | 2019-09 | 2019-08 | 2019-07 | 2019-05 | 2019-04 | 2019-02 | 2018-11 | 2018-10 | 2018-09 | 2018-08 | 2018-05 | 2018-04 | 2018-03 |
|---|---|---|---|---|---|---|---|---|---|---|---|---|---|---|---|---|---|---|---|---|---|
| pm25 | 31 (Moderate) | 26 (Moderate) | 33 (Moderate) | 51 (Unhealthy for Sensitive Groups) | 47 (Unhealthy for Sensitive Groups) | 58 (Unhealthy) | 60 (Unhealthy) | 52 (Unhealthy for Sensitive Groups) | 32 (Moderate) | 26 (Moderate) | 32 (Moderate) | 43 (Unhealthy for Sensitive Groups) | 38 (Unhealthy for Sensitive Groups) | 60 (Unhealthy) | 68 (Unhealthy) | 38 (Unhealthy for Sensitive Groups) | 50 (Unhealthy for Sensitive Groups) | 39 (Unhealthy for Sensitive Groups) | 66 (Unhealthy) | 84 (Very Unhealthy) | 142 (Very bad Hazardous) |
| pm10 | 60 (Unhealthy for Sensitive Groups) | 57 (Unhealthy for Sensitive Groups) | 68 (Unhealthy for Sensitive Groups) | 102 (Unhealthy) | 102 (Unhealthy) | 119 (Very Unhealthy) | 121 (Very Unhealthy) | 111 (Very Unhealthy) | 71 (Unhealthy for Sensitive Groups) | 59 (Unhealthy for Sensitive Groups) | 73 (Unhealthy for Sensitive Groups) | 129 (Very Unhealthy) | 77 (Unhealthy for Sensitive Groups) | 203 (Very bad Hazardous) | 190 (Very bad Hazardous) | 108 (Unhealthy) | 67 (Unhealthy for Sensitive Groups) | 84 (Unhealthy) | 160 (Very bad Hazardous) | 154 (Very bad Hazardous) | 124 (Very Unhealthy) |
| no2 | 12 (Good) | 6.8 (Good) | 15 (Good) | 28 (Good) | 27 (Good) | 25 (Good) | 23 (Good) | 23 (Good) | 15 (Good) | 13 (Good) | 10 (Good) | 19 (Good) | 20 (Good) | 23 (Good) | 23 (Good) | 30 (Good) | 20 (Good) | 13 (Good) | 25 (Good) | 27 (Good) | 32 (Good) |
| so2 | 10 (Good) | 7.7 (Good) | 12 (Good) | 12 (Good) | 9.4 (Good) | 11 (Good) | 9.5 (Good) | 11 (Good) | 12 (Good) | 6.1 (Good) | 6.6 (Good) | 14 (Good) | 11 (Good) | 15 (Good) | 11 (Good) | 7.2 (Good) | 6.4 (Good) | 7.7 (Good) | 12 (Good) | 10 (Good) | 11 (Good) |
| co | 479 (Good) | 428 (Good) | 860 (Good) | 1 (Good) | 1 (Good) | 1 (Good) | 1 (Good) | 1 (Good) | 938 (Good) | 851 (Good) | 863 (Good) | 586 (Good) | 641 (Good) | 1 (Good) | 1 (Good) | 1 (Good) | 965 (Good) | 637 (Good) | 1 (Good) | 25 (Good) | 53 (Good) |
| o3 | 53 (Good) | 50 (Good) | 51 (Good) | 42 (Good) | 34 (Good) | 34 (Good) | 34 (Good) | 28 (Good) | 23 (Good) | 29 (Good) | 30 (Good) | 57 (Good) | 39 (Good) | 29 (Good) | 39 (Good) | 31 (Good) | 36 (Good) | 23 (Good) | 40 (Good) | - (Good) | - (Good) |
PM10 82 (Unhealthy)
particulate matter (PM10) suspended dustSO2 8.5 (Good)
sulfur dioxide (SO2)PM2,5 26 (Moderate)
particulate matter (PM2.5) dustCO 590 (Good)
carbon monoxide (CO)NO2 29 (Good)
nitrogen dioxide (NO2)O3 12 (Good)
ozone (O3)Ashok Nagar, Udaipur - RSPCB
| index | 2022-10-31 |
|---|---|
| pm10 | 68 |
| so2 | 8 |
| pm25 | 24 |
| co | 505 |
| no2 | 28 |
| o3 | 10 |
Ashok Nagar, Udaipur - RSPCB

| index | 2020-05 | 2020-04 | 2020-03 | 2020-02 | 2020-01 | 2019-12 | 2019-11 | 2019-10 | 2019-09 | 2019-08 | 2019-07 | 2019-05 | 2019-04 | 2019-02 | 2018-11 | 2018-10 | 2018-09 | 2018-08 | 2018-05 | 2018-04 | 2018-03 |
|---|---|---|---|---|---|---|---|---|---|---|---|---|---|---|---|---|---|---|---|---|---|
| pm25 | 31 | 26 | 33 | 51 | 47 | 58 | 60 | 52 | 32 | 26 | 32 | 43 | 38 | 60 | 68 | 38 | 50 | 39 | 66 | 84 | 142 |
| pm10 | 60 | 57 | 68 | 102 | 102 | 119 | 121 | 111 | 71 | 59 | 73 | 129 | 77 | 203 | 190 | 108 | 67 | 84 | 160 | 154 | 124 |
| no2 | 12 | 6.8 | 15 | 28 | 27 | 25 | 23 | 23 | 15 | 13 | 10 | 19 | 20 | 23 | 23 | 30 | 20 | 13 | 25 | 27 | 32 |
| so2 | 10 | 7.7 | 12 | 12 | 9.4 | 11 | 9.5 | 11 | 12 | 6.1 | 6.6 | 14 | 11 | 15 | 11 | 7.2 | 6.4 | 7.7 | 12 | 10 | 11 |
| co | 479 | 428 | 860 | 1 | 1 | 1 | 1 | 1 | 938 | 851 | 863 | 586 | 641 | 1 | 1 | 1 | 965 | 637 | 1 | 25 | 53 |
| o3 | 53 | 50 | 51 | 42 | 34 | 34 | 34 | 28 | 23 | 29 | 30 | 57 | 39 | 29 | 39 | 31 | 36 | 23 | 40 | - | - |